Gustavo Santos
Data Science Portfolio of Gustavo R Santos
| PROJECT 1
Car Prices Regression Analysis
This is a complete Regression Analysis Project where I demonstrate the exploratory data analysis as well as train a Random Forest Regression model to estimate prices of cars in Brazil.
The main skills demonstrated in this project are:
- Data Collecting: I have collected data from the internet to create this dataset with 1352 observations. The data was collected on August, 2021.
- Data Cleaning: I have cleaned, parsed, formatted the data to make it ready for modeling.
- Exploratory Data Analysis: I have done the descriptive statistical analysis, univariated and bivariated analysis to understand the dataset.
- Data Visualization: Several graphics plotted (bars, boxplots, scatterplots etc
- Data inputation: I’ve inputed data using ML prediction with Random Forest from missingpy library.
- Outliers: I have identified and removed outliers for better performance of the model.
- Testing and Fitting: There are 5 models in this project and they were improved at each iterations with Feature Engineering, Cross Validation and Grid Search techniques, reaching a 95% of Explained Variance (R-Squared)
- The Project ends with the Web App created with Streamlit deployed.

| PROJECT 2
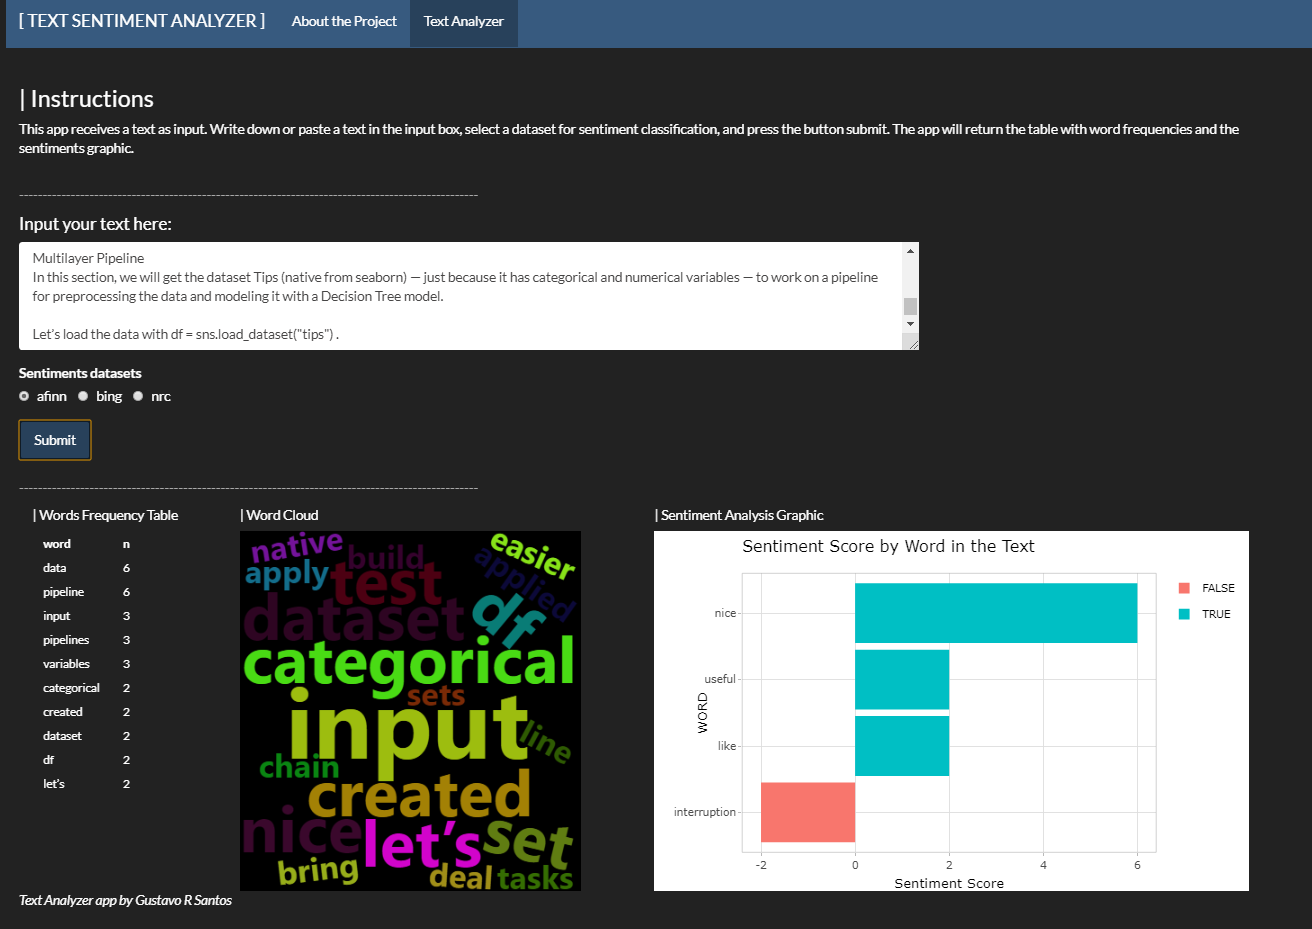
Text Sentiment Analyzer
The project uses R Language to create a Shiny web application that reads a text and returns the word frequencies, a Word Cloud and a graphic with sentiment analysis. Abilities developed:
- Natural Language Processing - frequency table, word cloud
- Tidytext
- Sentiment Analysis
- Creating web applications with Shiny Apps for R
See more information in this Medium Post and visit the app
| PROJECT 3
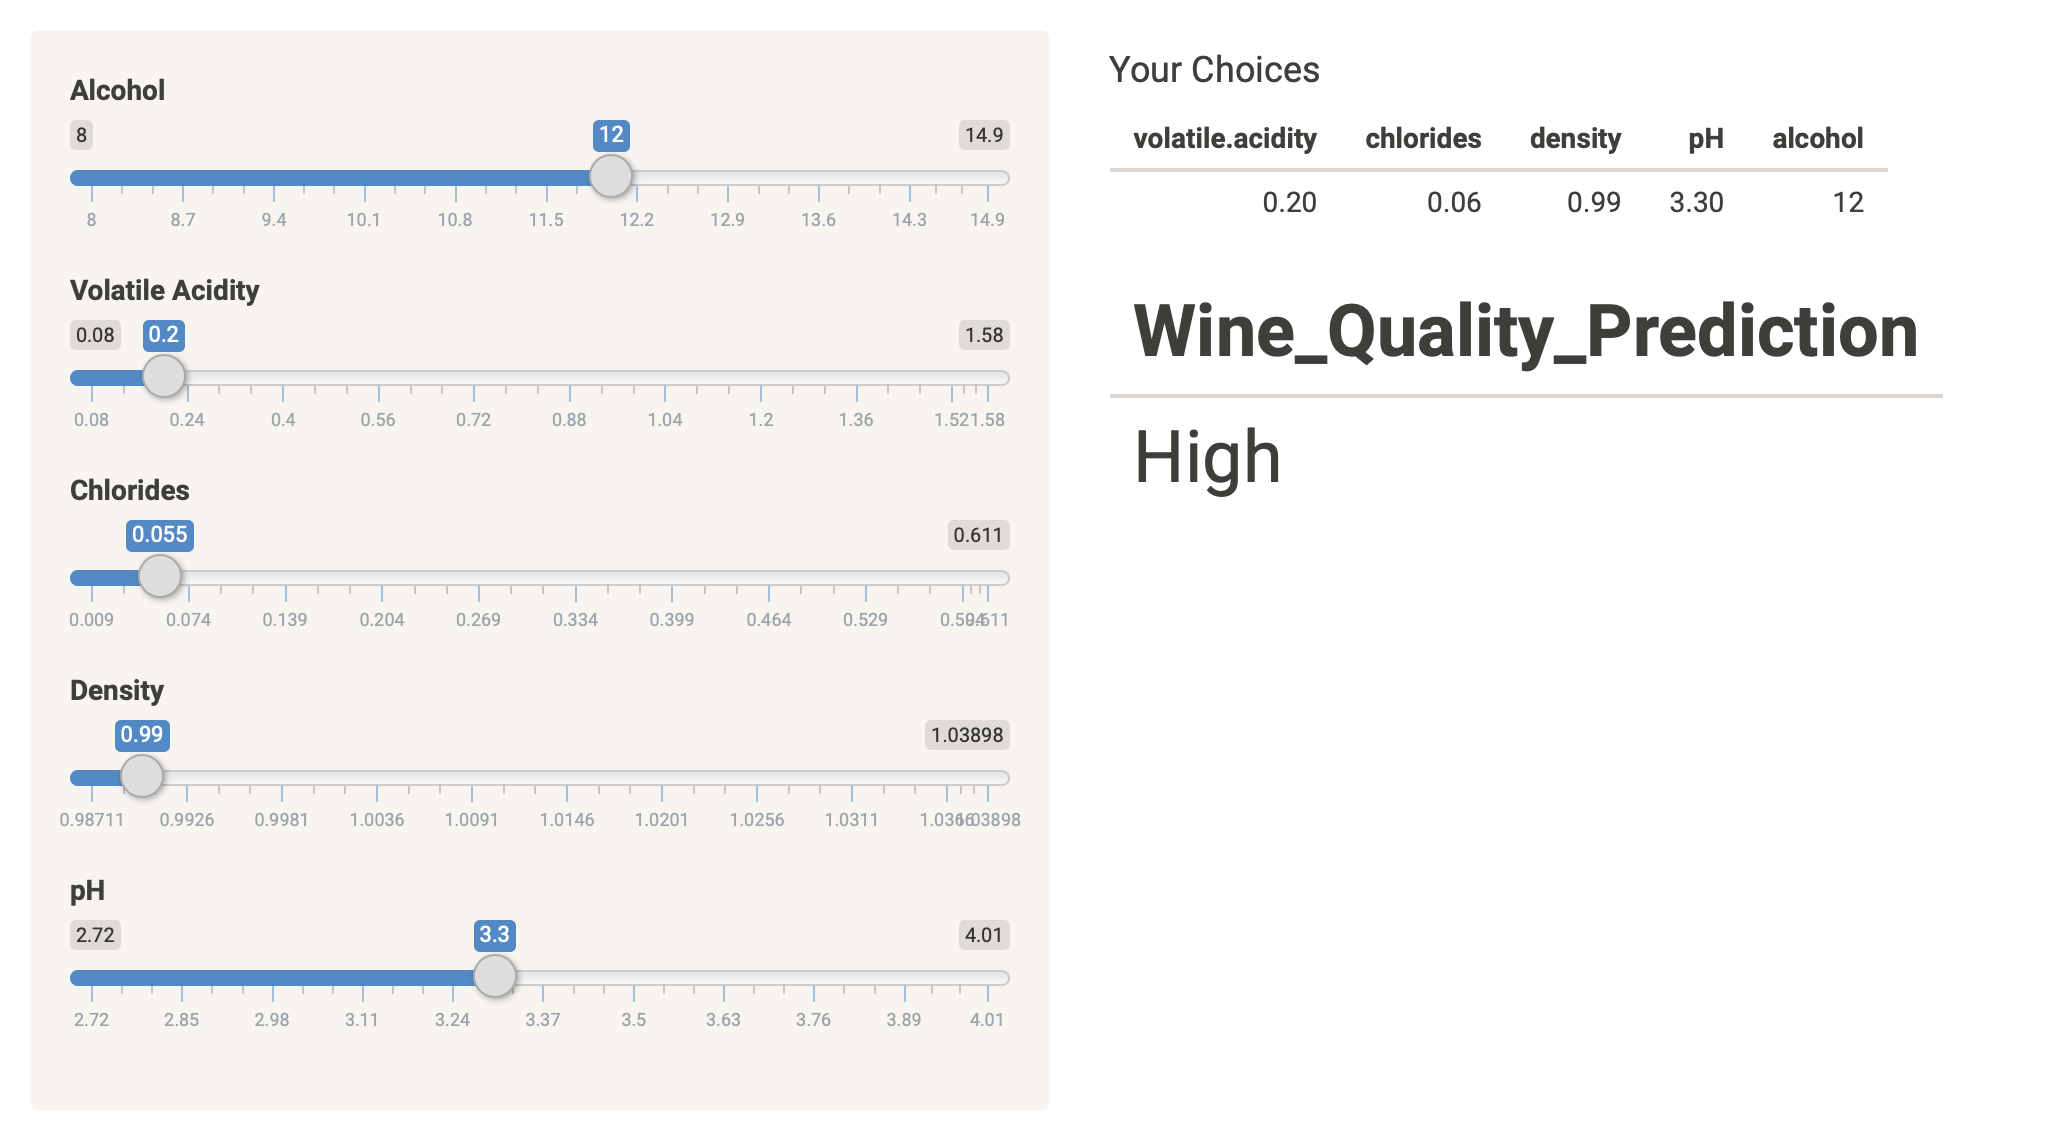
Wine_Quality_Predictions
In this project, the idea was to simulate a business problem where a client (winery) had some data about their products and they wanted to see how the variables measured could possibly affect the wine quality, therefore, resulting in higher or lower grades for their wines. Then the client wanted to have their dataset divided in two clusters (white and red wines) and finally see some predictions about the quality for their new wines. It was all developed in R language, using R to build the app. The work was divided in 3 main parts:
- Exploring the data and creating some data visualizations, understanding the correlations between variables. The result is on the first three tabs of the app: Histograms, Boxplots and Report.
- Divide the dataset in two clusters. I have gathered both datasets (red + white) to simulate a request from the client where they needed to know which wine was what kind. The result was 98% accurate and that can be seen on the Clustering tab.
- The final part was to create a Prediction Interactive Tool for the White Wines from the dataset that allows the client to input some values and have a prediction whether that wine is going to be qualified as High Quality (grades from 7-10) or Low Quality (grades from 3-6). You can interact with the tool in the tab Predictions. The accuracy is 95%.
See more information in this link or visit the app
| PROJECT 4
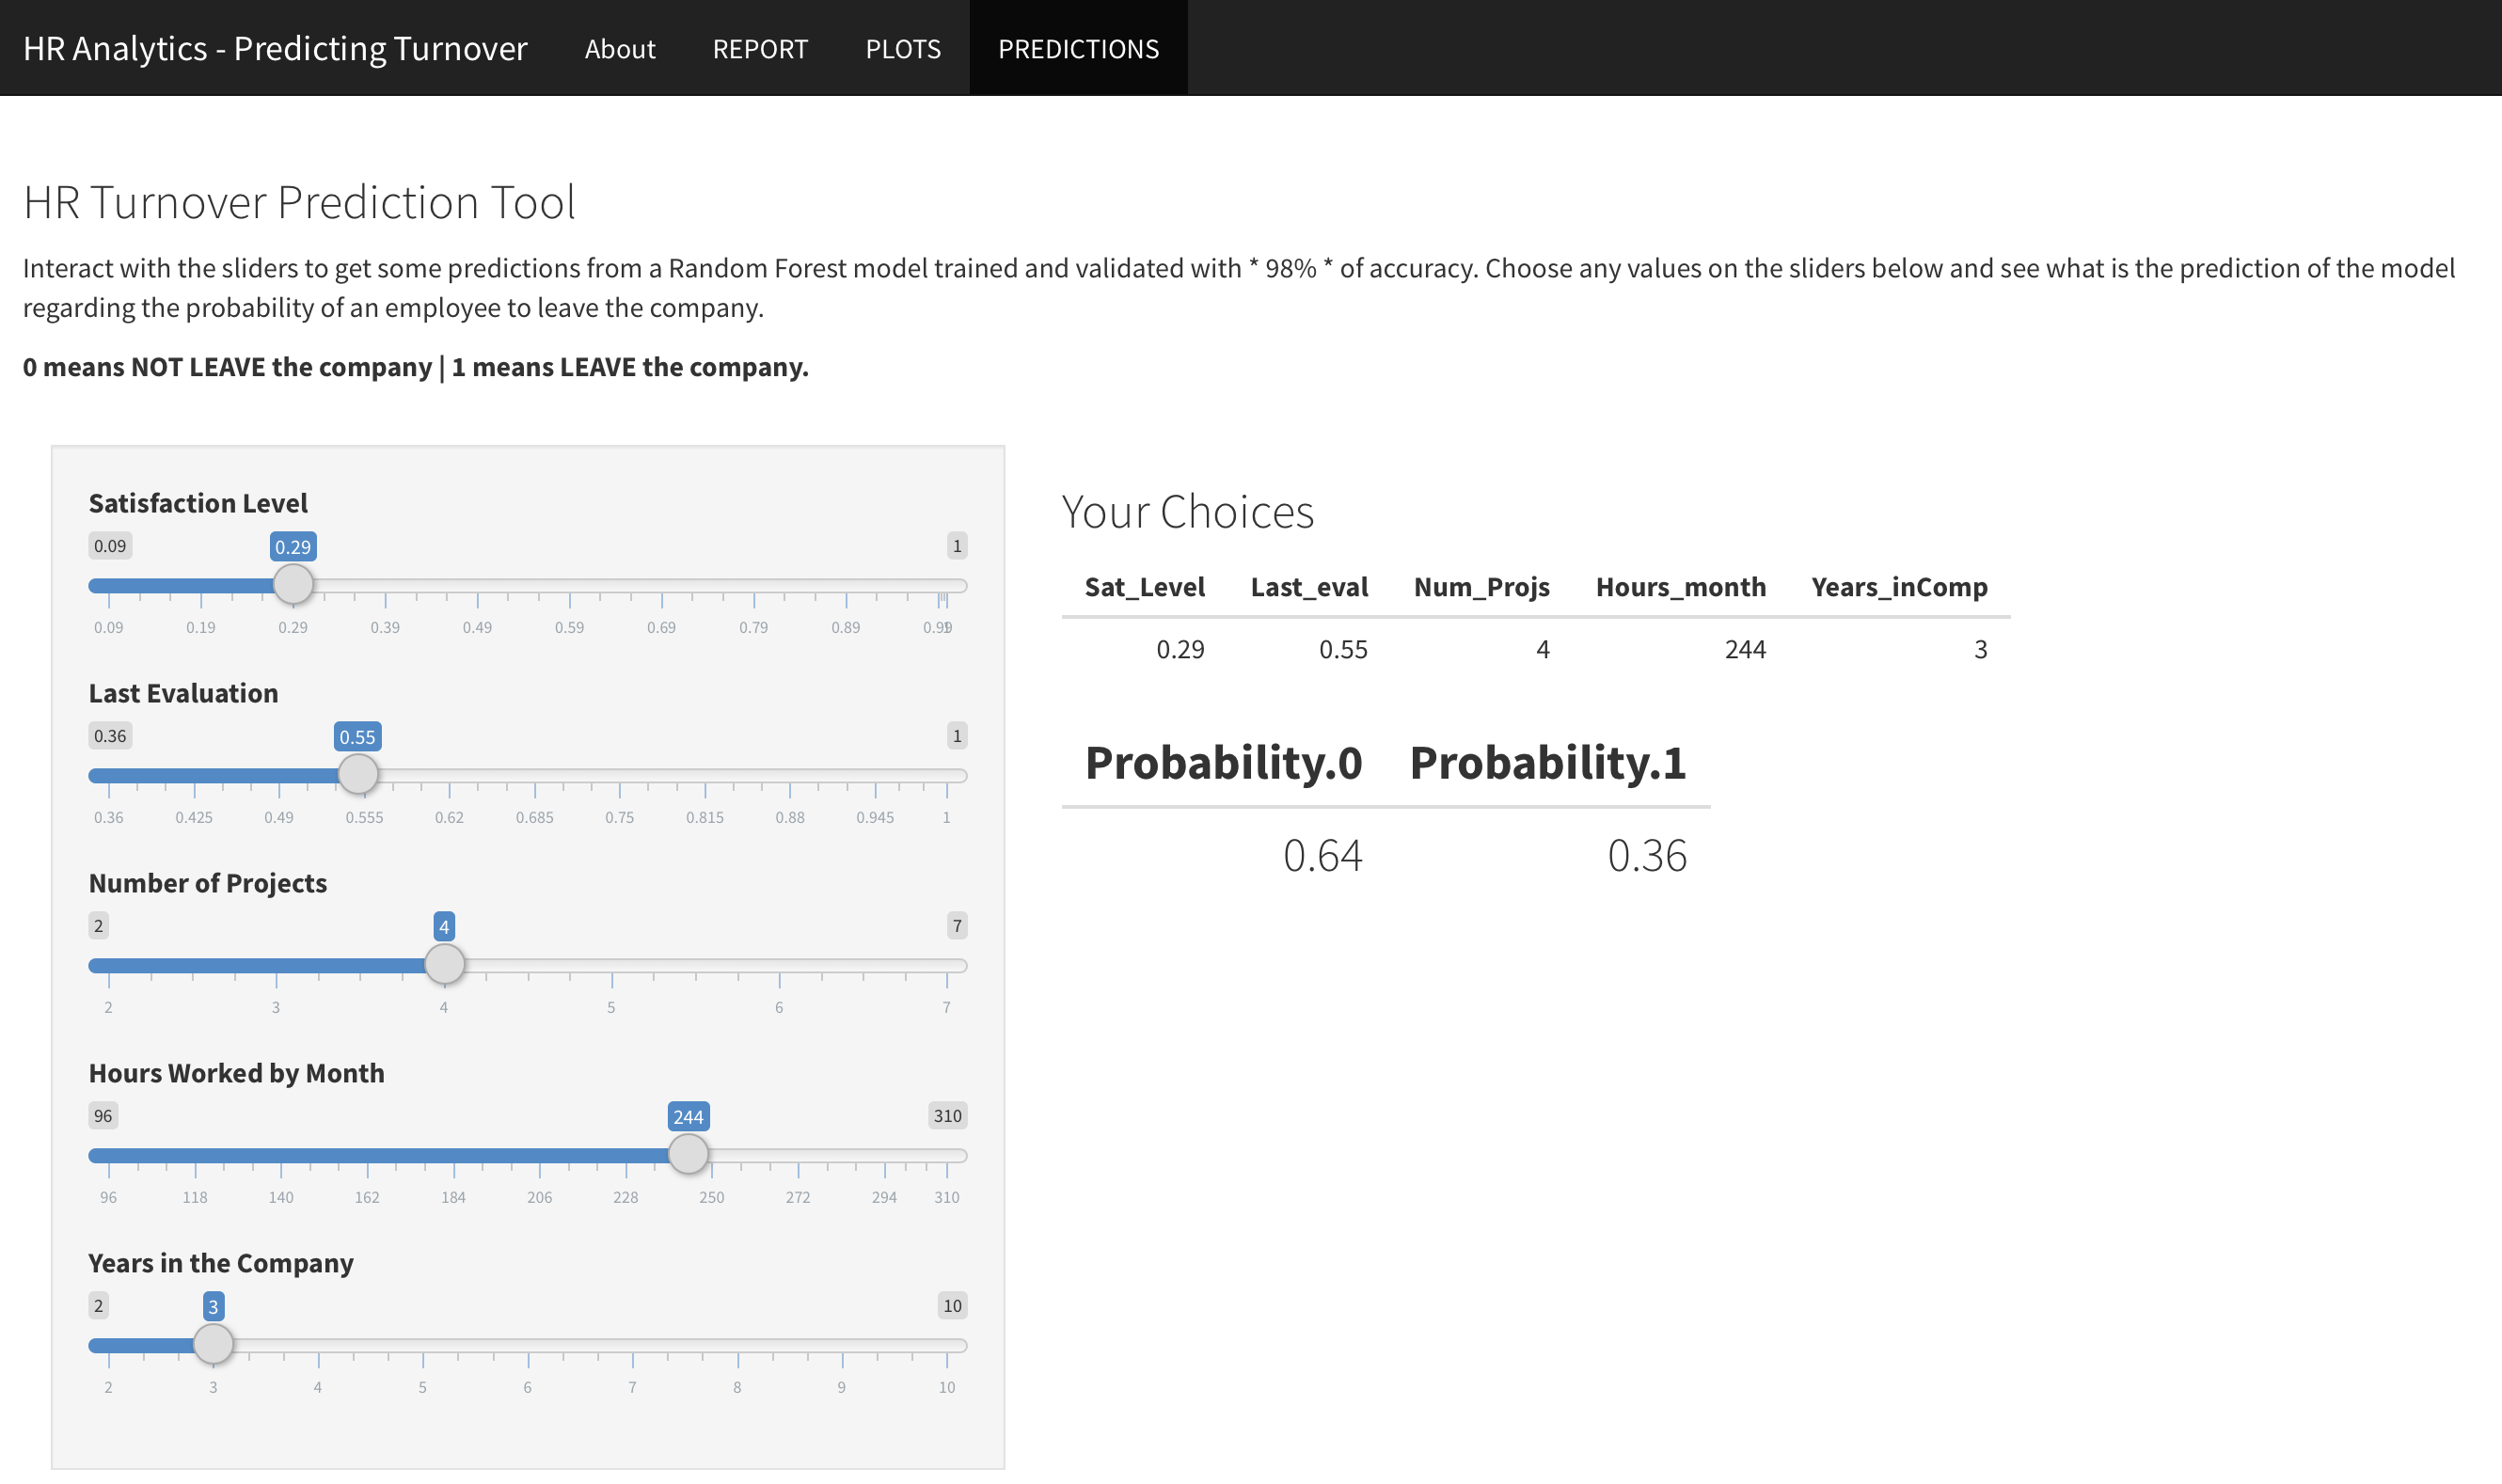
Predicting Employee Turnover of a Business
This is a Project from the Data Scientist Program Degree by Data Science Academy Brazil. The idea is to build a classification model to predict if an employee will or not leave the company based on the variables satisfaction level, number of projects one is working, number of hours worked in a month and the years this person is in that company.
Activities performed:
- Data Exploration and Analysis
- Data Visualization (Histograms, Boxplots, Barplots)
- Correlation check
- Feature Engineering with Random Forest to select the best attributes for the model
- Classification: Training and Prediction with Random Forest (99% accurate) and XGBoost (97% accurate)
- (Creation of Random Forest and XGBoost with tidymodels)
- Creation of a Shiny App for user interaction and make predictions.
Learn more about this project link or visit the Shiny app
| PROJECT 5
Bible Word Clouds
This project was created in R Language.
- Created a word cloud for each book in the Holy Bible.
- Used for lops
- Saved results in a PDF.
| PROJECT 6
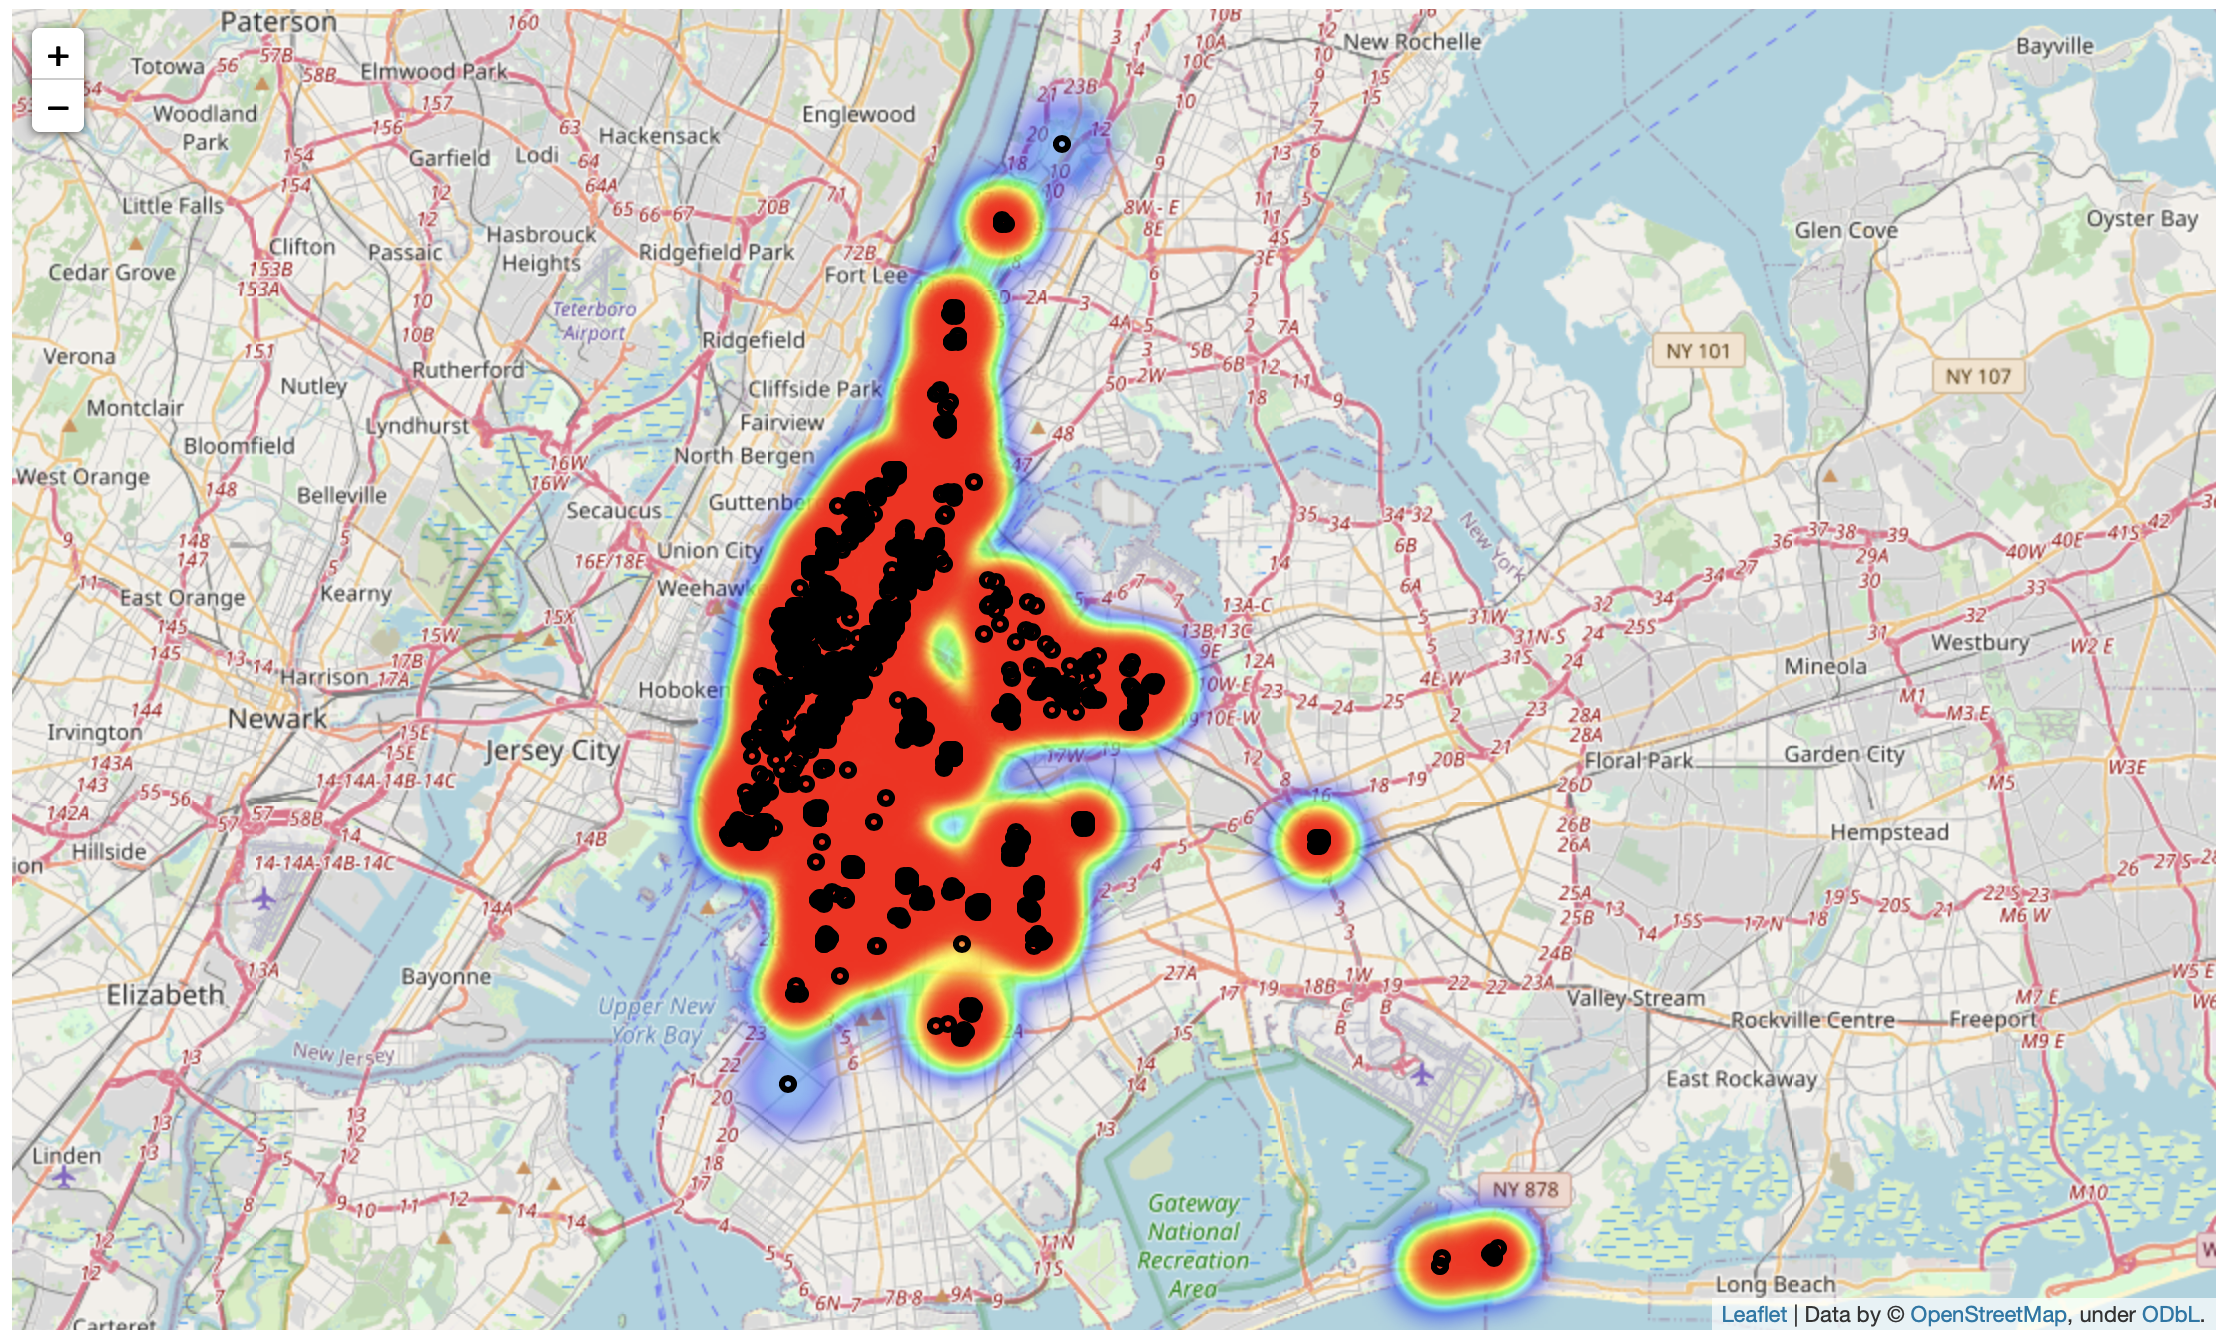
NYC-Airbnb
In this project, I was able to do a complete analysis with data exploration and visualization study on the ‘New York City Airbnb Open Data’.
- Created some plots to show the data and extract insights
- Boxplots, histograms, bar graphics
- Created a Map using Folium package with the locations of the places for rent and added HeatMap by price
- Did a simple Natural Language Processing with nltk to analyze the reviews of the rentals.
- Word Cloud, word frequence count, Bigrams and Trigrams analysis.
- Wrote a Conclusion Report.
See more information in this link.
| PROJECT 7
Recommendation Systems
In this project, I have created three different types of Recommendation Systems using Python and the surprise package.
- I have created a Popularity Based Recommender
- Created an Item-Based Recommender: Collaborative Filtering
- Created a Model-Based Recommender with SVD algorithm (matrix factorization).
Learn more about this project: link

| PROJECT 8
Tweet’s Analysis
In this project, I have extracted 100 tweets using Tweepy to analyze them. Activities performed:
- Data extraction from Twitter using Tweepy
- Data Exploratory Analysis including manipulation of dates, text and numbers
- Data Visualization of locations with most tweets, date and hours when people tweet the most about the given subject
- Natural Language Processing using nltk package, being able to create Word Cloud, frequency count and N-Grams analysis
- Topic Analysis of the text using LDA algorithm
- Sentiment Analysis using Text Blob

| PROJECT 9
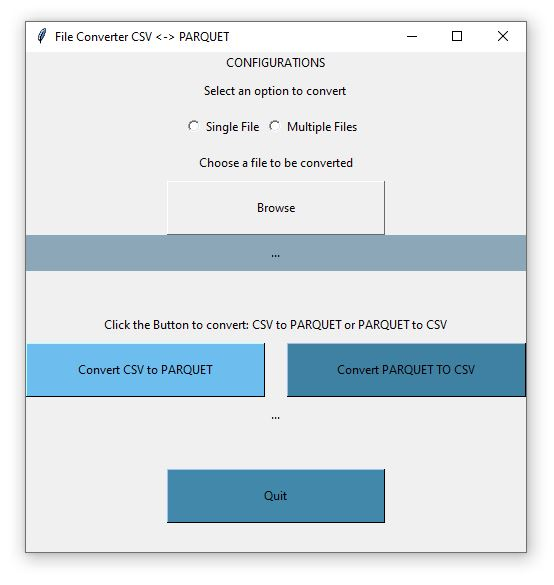
CSV_to_Parquet_Program
Windows application that converts files from CSV to Parquet format or Parquet to CSV.
The main points learned with this project were:
- Learn how to create a GUI (Graphic User Interface) using the tkinter Python package.
- Learn something about creating a software, the steps, options offered to the user and programming structure.
- Create a Windows application to help people converting their files from CSV to Parquet compressed file format.
Currently, CSV is one of the most popular data files, as it is easily shareable and many Data Analysis programs can read it. Ergo, the CSV file format became very popular. However, the downside is that the format takes a lot of space in disk. As the number of rows start to increase, the file size grows accordingly. When you have more than 10 thousand rows you start to see the difference between CSV file size and Parquet file size - .parquet was 5 times smaller in a test with a 5GB csv file.
This program is available Free for Use under the MIT license, meaning it can be used, copied or changed for personal or commercial use. I only ask that my name is mentioned in the credit.
| PROJECT 10
Credit Card Fraud Detection
This is a classic Data Science project created in Python to detect fraudulent transactions in this dataset.
The main skills demonstrated in this project are:
- Exploratory Data Analysis: I have done a quick check and plotted some graphics to get a better understanding of the data. However, the variables were transformed, so not too deep analysis could be performed.
- Data Visualization: graphics plotted (bars, boxplots, scatterplots etc)
- Data scaling and balancinginputation: I have scaled some variables to make the data more uniform and used Oversampling and Undersampling techniques to balance the dataset, as it contains only 0.17% of the minoritary class.
- Model Selection: There are 4 models. I used Cross Validation to select the best option, reaching over 99% of F1 score (Precision / Recall)
| PROJECT 11
Diamont Carat Prediction with KNN Regression
In this project, the intention is to train a model that will predict the carat size of a diamond based on the sizes of its cut.
The main skills demonstrated in this project are:
- Exploratory Data Analysis: Analyzed the data to select the best features for prediction, checked for missing data.
- Data Visualization: graphics plotted (bars, boxplots, scatterplots etc)
- Remove Outliers: This data had a lot of outliers, so I have removed them to improve the model.
- Log Transformation: The explanatory variables have a slightly exponential relationship with the target variable. A Log transformation solved it.
- Model Selection: There are 3 models trained, being Linear Regression with no variable transformation, LR with Log transformation and KNN Regression.
| PROJECT 12
News Headlines Classifier with Multinomial NB
In this project, I have created a simple model to classify news headlines in categories.
This small project covers the skills:
- Web scraping
- Pandas manipulation
- Creation of a news headline classifier created with Multinomial Naïve Bayes from sklearn.
Read more about this project in my Medium blog post
| PROJECT 13
Data-Engineering-Pipeline
Creating a Data Pipeline for Stock Data
In this project, I have performed the following tasks:
- Fetching data from APIs
- Dump it into the cloud (Databricks folder)
- Start cleaning the data, transforming from json to data frame, correcting data types, dropping unwanted observations
- Gathering the different stocks in a single dataset, joining and calculating some indicators like moving averages and Relative Strength Index (RSI)
- Sending the data to a PostgreSQL database for consumption
- Connecting with Power BI and creating a final report for insights.
For full description of the project, step-by-step, visit the Medium Post.